SC Climate Division 7 — Southern ◼ ◼
SC Climate Division 7 — Southern
Eight weather stations: BAMBERG, BEAUFORT WWTP, CHARLESTON INTL AP, CHARLESTON CITY, GIVHANS FERRY 2 ESE, SULLIVANS ISLAND, SUMMERVILLE 4W, YEMASSEE
Click on legend items to hide or reveal data ![]()
SC Climate Division 7 — Southern
Average Monthly Precipitation
Data Source: NOAA’s Satellite and Information Service | National Environmental Satellite, Data, and Information Service (NESDIS)
Hover over squares for precipitation amounts ![]()
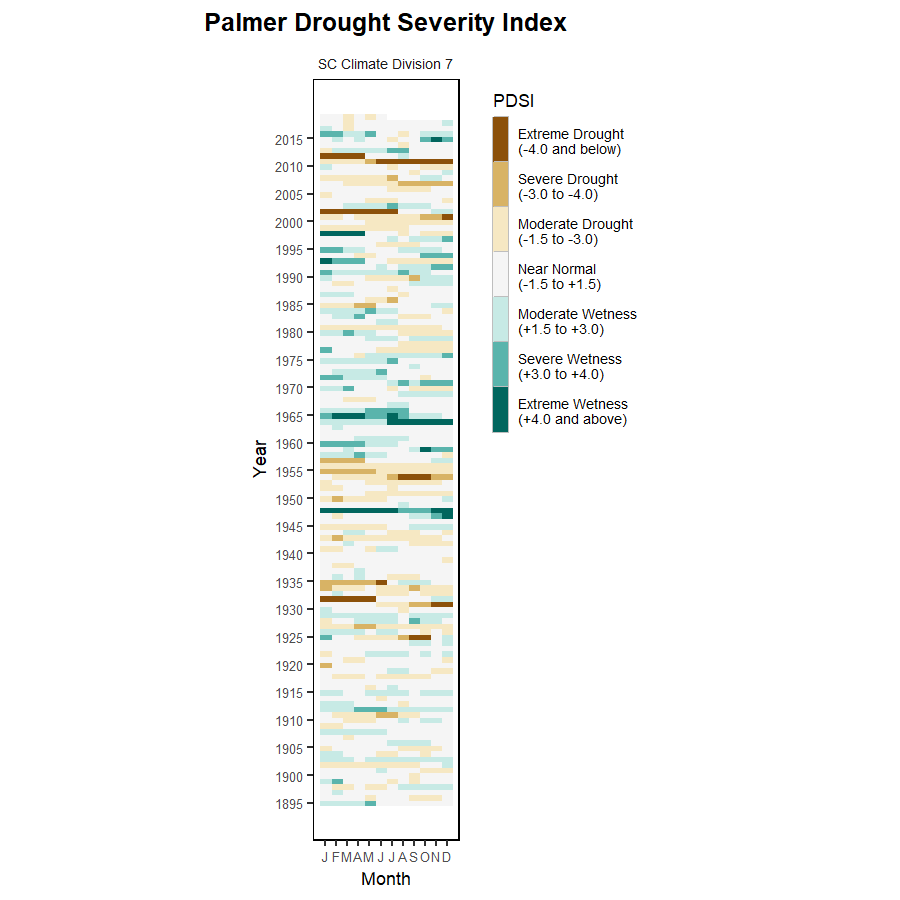
SC Climate Division 7 — Southern
Historical Monthly Precipitation, 1895–2016
Data Source: NOAA’s Satellite and Information Service | National Environmental Satellite, Data, and Information Service (NESDIS)