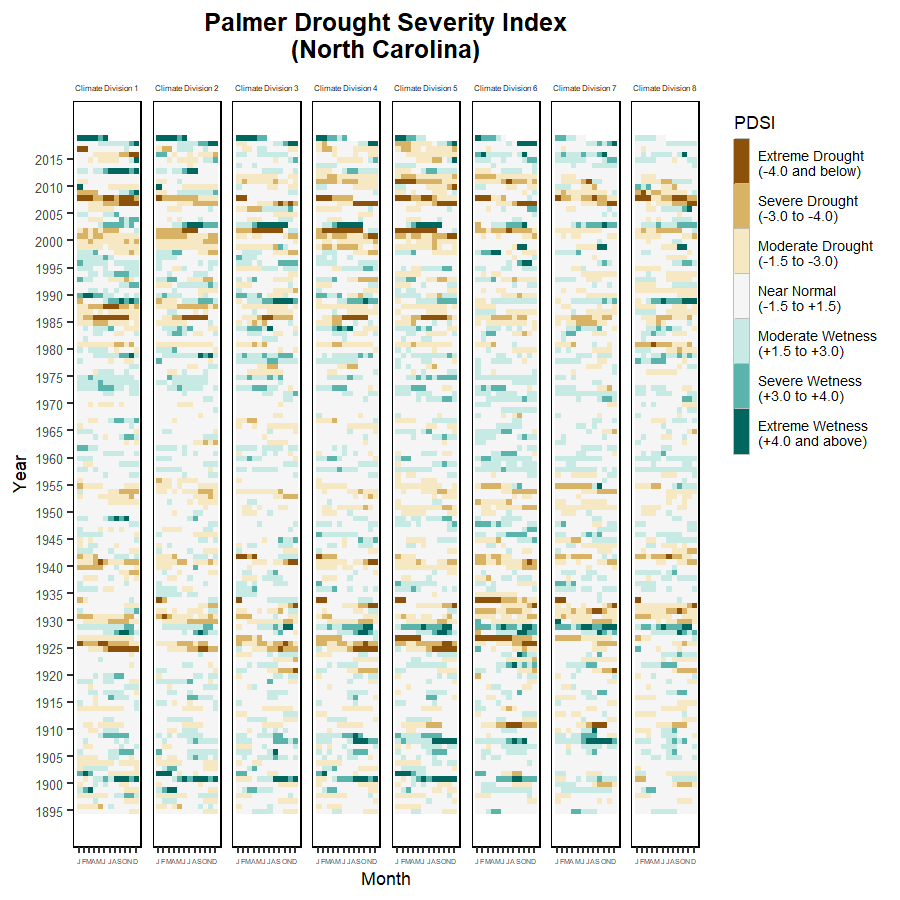
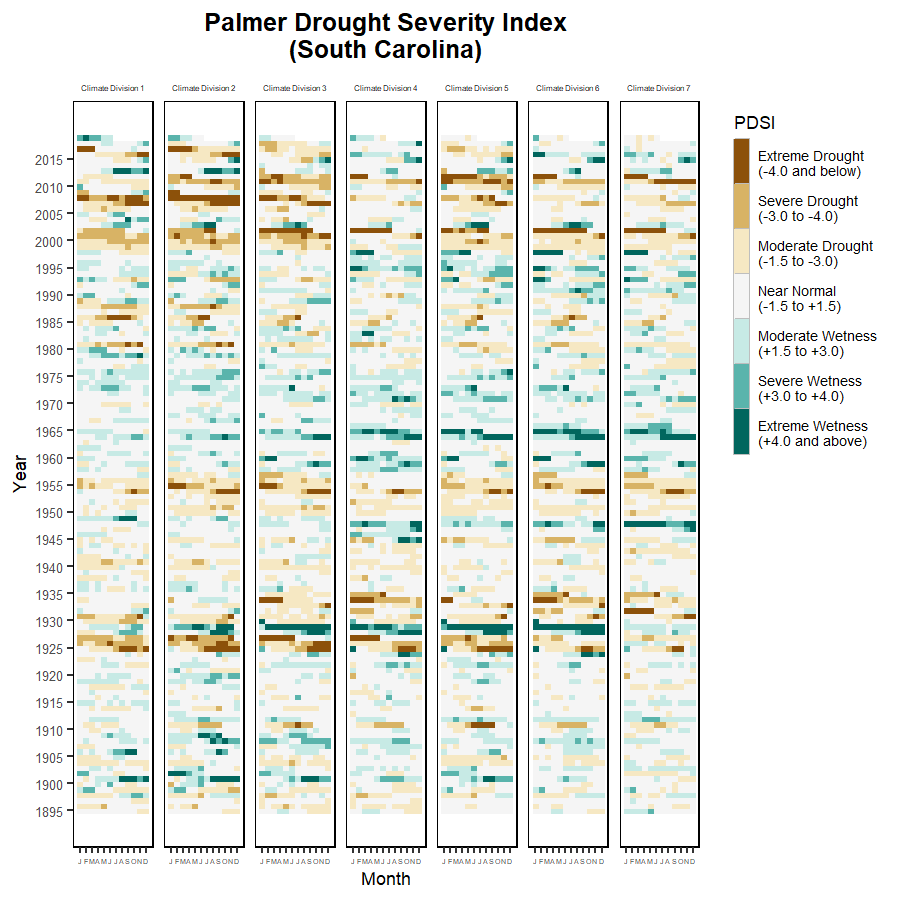
This chart shows a specified drought measure for each month from 1895 onward. Each row represents a single year; each column a single month, January through December from left to right. These charts help to identify unusually wet or dry periods in history. See the glossary for additional information on each drought measure.