NC Climate Division 8 — Northern Coastal Plain ◼ ◼
NC Climate Division 8 — Northern Coastal Plain
Eight weather stations: ELIZABETH CITY, ENFIELD, JACKSON, LEWISTON, PLYMOUTH 5 E, ROCKY MOUNT, ROCKY MT 8 ESE, WILLIAMSTON 1 E
Click on legend items to hide or reveal data ![]()
NC Climate Division 8 — Northern Coastal Plain
Average Monthly Precipitation
Data Source: NOAA’s Satellite and Information Service | National Environmental Satellite, Data, and Information Service (NESDIS)
Hover over squares for precipitation amounts ![]()
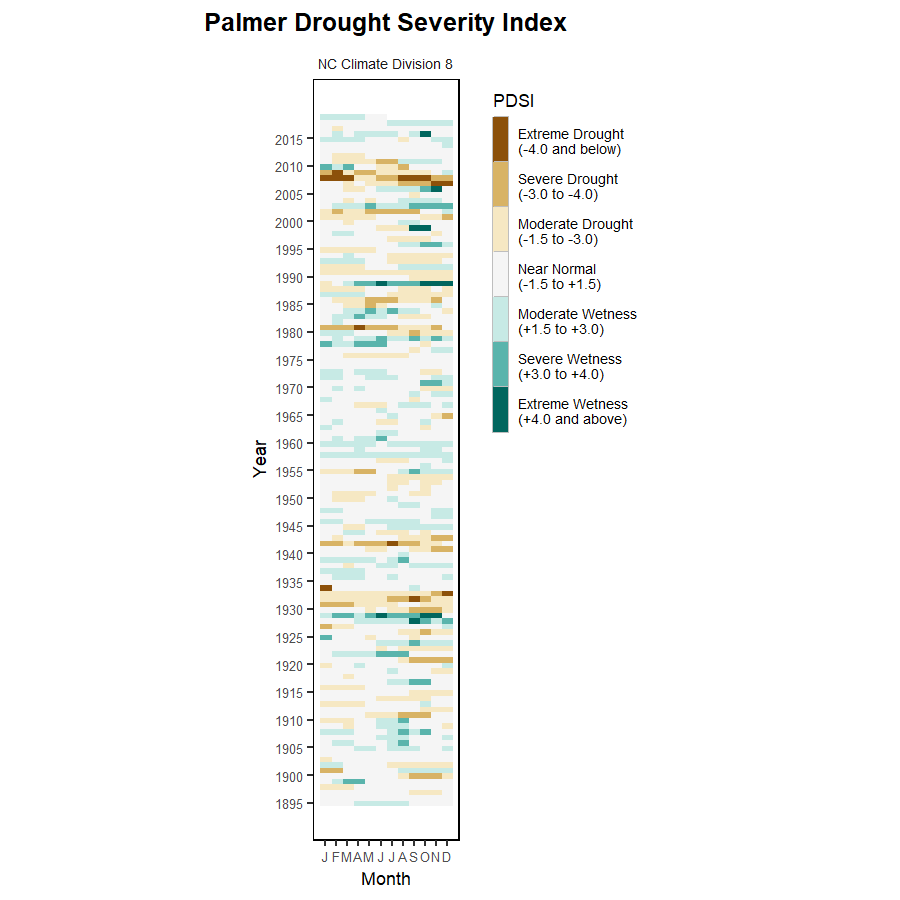
NC Climate Division 8 — Northern Coastal Plain
Historical Monthly Precipitation, 1895–2016
Data Source: NOAA’s Satellite and Information Service | National Environmental Satellite, Data, and Information Service (NESDIS)