NC Climate Division 5 — Southern Piedmont ◼ ◼
NC Climate Division 5 — Southern Piedmont
Eight weather stations: ALBEMARLE, CARTHAGE WTP, CHARLOTTE DOUGLAS AP, HAMLET, JACKSON SPRINGS 5 WNW, LINCOLNTON 4 W, MONROE 2 SE, WADESBORO
Click on legend items to hide or reveal data ![]()
NC Climate Division 5 — Southern Piedmont
Average Monthly Precipitation
Data Source: NOAA’s Satellite and Information Service | National Environmental Satellite, Data, and Information Service (NESDIS)
Hover over squares for precipitation amounts ![]()
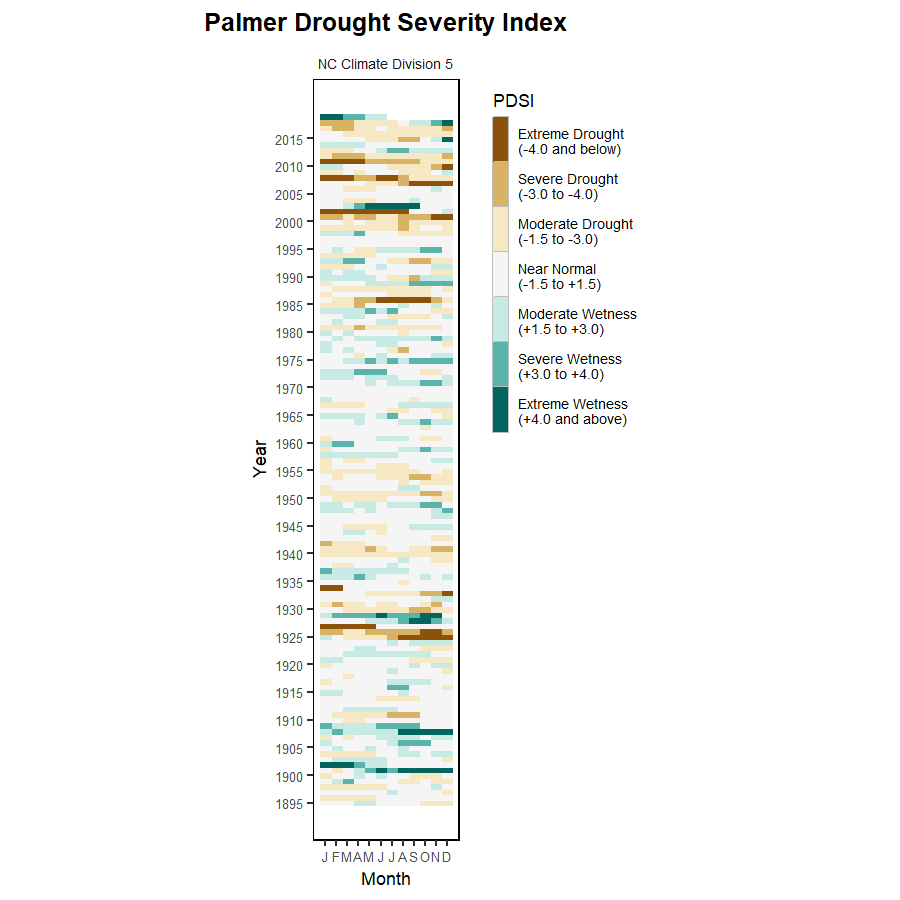
NC Climate Division 5 — Southern Piedmont
Historical Monthly Precipitation, 1895–2016
Data Source: NOAA’s Satellite and Information Service | National Environmental Satellite, Data, and Information Service (NESDIS)