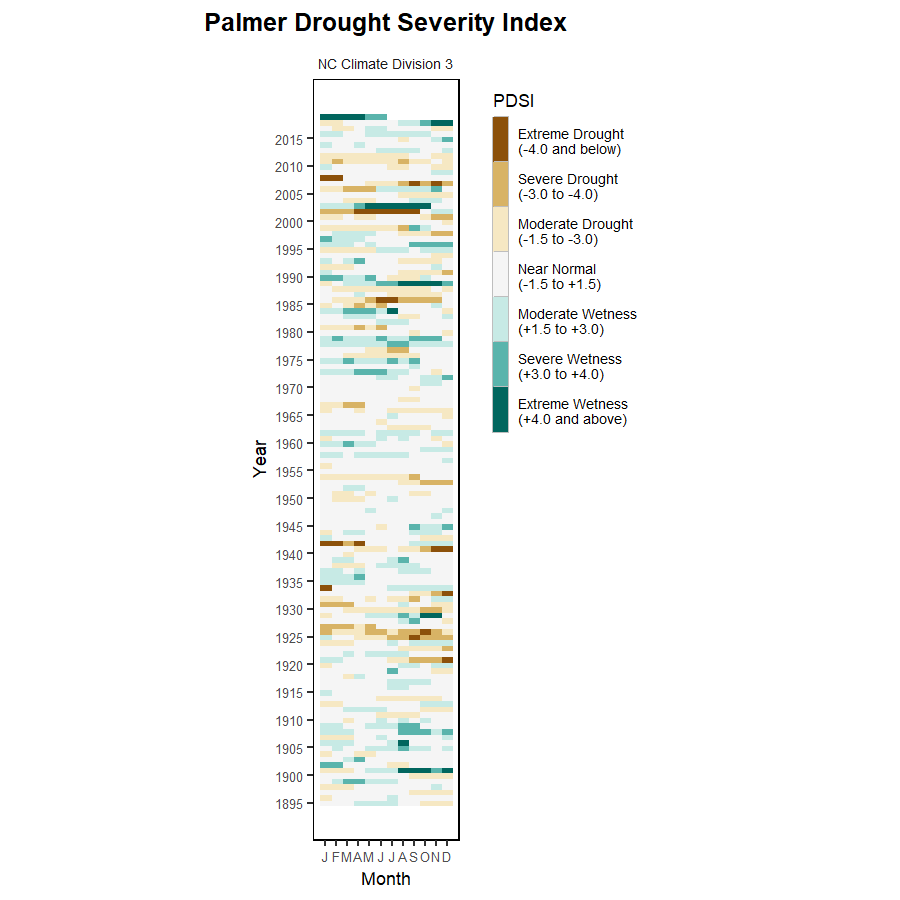
NC Climate Division 3 — Northern Piedmont ◼ ◼
NC Climate Division 3 — Northern Piedmont
Eleven weather stations: BURLINGTON FIRE STN #5, CHAPEL HILL 2 W, DANBURY, DURHAM, EDEN, GRAHAM 2 ENE, GREENSBORO AP, HENDERSON 2 NNW, HIGH POINT, LOUISBURG, SPRAY
Click on legend items to hide or reveal data ![]()
NC Climate Division 3 — Northern Piedmont
Average Monthly Precipitation
Data Source: NOAA’s Satellite and Information Service | National Environmental Satellite, Data, and Information Service (NESDIS)
Hover over squares for precipitation amounts ![]()
NC Climate Division 3 — Northern Piedmont
Historical Monthly Precipitation, 1895–2016
Data Source: NOAA’s Satellite and Information Service | National Environmental Satellite, Data, and Information Service (NESDIS)