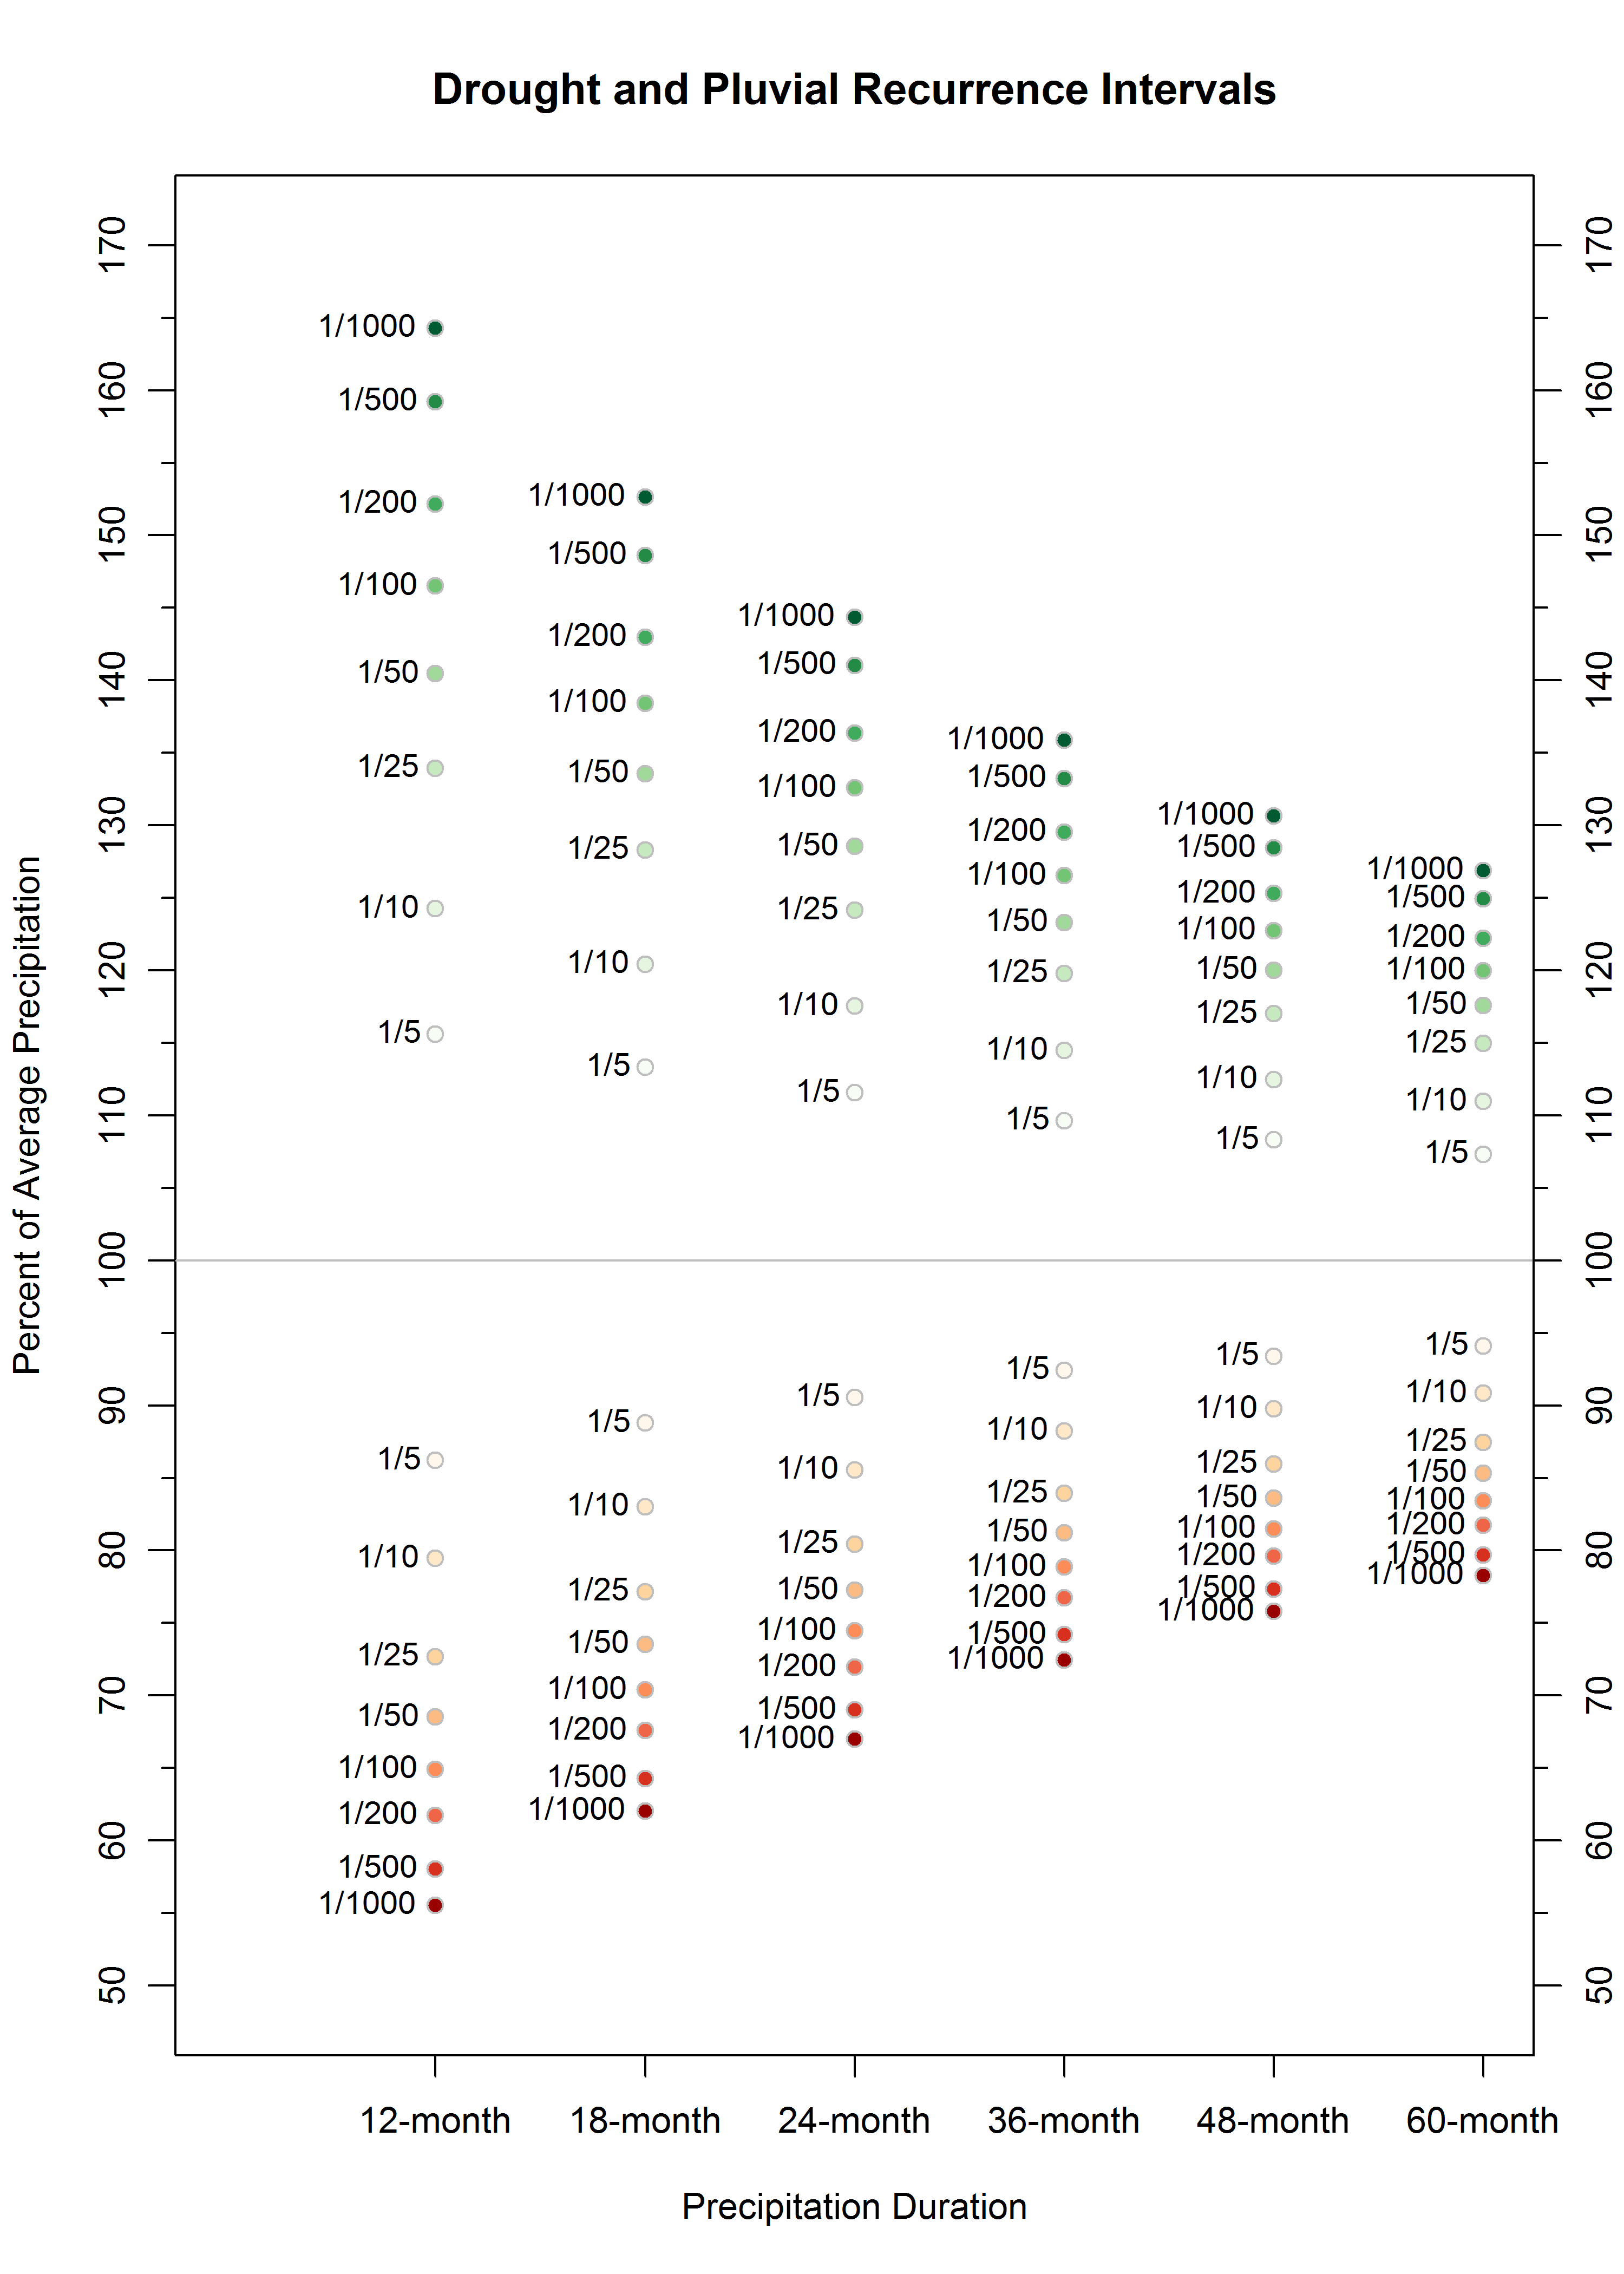
This chart shows the likelihood of wet or dry conditions for a specified duration from 1 to 5 years. Each dot represents the probability of receiving a certain percentage of average precipitation for the specified duration. These probabilities are averaged for all stations in the Carolinas. Contour maps show small variations in recurrence across the region.